 Главная страница -> Измерительная техника -> Ватметры и КВС метры. -> RF Power Meter, based on the AD8307 Главная страница -> Измерительная техника -> Ватметры и КВС метры. -> RF Power Meter, based on the AD8307
| Здравствуйте Гость ( Вход | Регистрация ) | Выслать повторно письмо для активации |
 |
A very simple to build, menu driven RF Power Meter, based on the AD8307 log amp
nanowatts to kilowatts, dBm, volts over 50 ohm 1, 2.5 or 5 second peak envelope power – average power and amplitude modulation index – in-line (using a power tap) or terminated metering 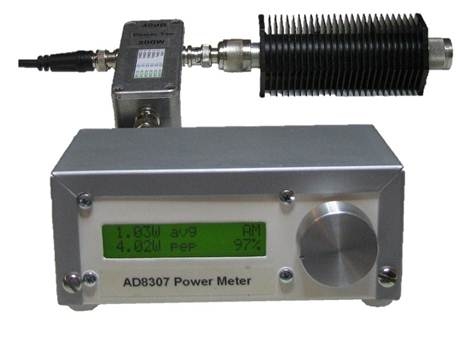 The below is based on a very popular power meter by WZ7OI/W7PUA, described by in QST in June 2001 (Ref: Wes Hayward, W7ZOI, and Bob Larkin, W7PUA, “Simple RF-Power Measurement,” QST, June 2001, pages 38-43) The project described here uses an Atmel AT90USB1286 microcontroller to sample the output from AD8307 logarithmic amplifier from Analog Devices, 200 times per second. This relatively high sampling rate is used to generate various outputs, displayed on a 16x2 Liquid Crystal Display (LCD), and optionally also transmitted to a computer over USB. A Rotary Encoder with a built in Pushbutton is used to navigate the various displays and to access a settings/configuration menu.. Contents Examples of displays selectable by turning the rotary encoder: Circuit description: Rotary Encoder and Pushbutton control menus: Computer readable data and USB commands The Microcontroller Firmware: 200W 40dB Power Tap: 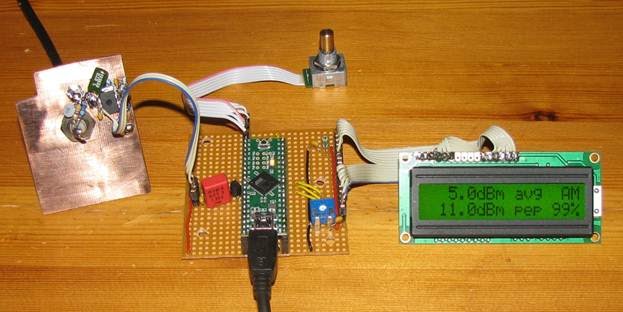 Examples of displays selectable by turning the rotary encoder: This display indicates power in decibels over 1 milliwatt (dBm). With an amplitude modulation index of 100%, the peak power is four times or 6dB higher than the average power. It was quite a confidence level boost to note that the AM index tracks the amplitude modulation levels I dialed into my Fluke 6062A signal generator within +/- 1%.  The meter automatically scales the output, from picowatts (-70dBm = 100pW) and up to kilowatts if an appropriate external attenuator or power tap is used. The avg value shows the one second average (average of the last 200 measurements). The PEP value indicates the highest value measured within the last second. The AM field indicates amplitude modulation index.  This display is useful when evaluating against an oscilloscope reading  For an analog meter feeling, there are two bargraph displays  The first bargraph has a range of 100dB, from -80 to +20dBm. The second one has a range of +/- 8dB, centered to a current reading by pressing the pushbutton.   Circuit description: R2, C1, C2 and L1 are for frequency response compensation up to 500 MHz, copied from the circuit description by W7ZOI and W7PUA. The output of the AD8307 has a +/-0.5dB lowpass response corner frequency of approx 10 MHz. C4 at 2.2nF lowers the corner frequency to approx 100kHz. This is adequate to get a ripple free response irrespective of the RF input frequency being measured, while retaining the ability to track amplitude modulation index and peak envelope power with good accuracy. The output from the AD8307 varies from approximately 0.3V at less than -70dBm to 2.5V at 15dBm, with a slope of approximately 25mV per dB. Circuit diagram  Teensy++ is a USB development board available at PJRC.com, containing an AT90USB1286 microcontroller running at 16 MHz. The AT90USB1286 has a program memory of 128 kilobytes and is a bit of an overkill for this project, to date the firmware only uses about 15% of the available program memory. MCP1541: voltage reference for the built in 10bit analog to digital converter (A/D) in the microcontroller. 4.096V/1024 is 4mV. 4mV/25mV per dB gives a measurement resolution of 0.16dB. The rotary encoder I used is CUI C14D32P-B3, 32 pulses per revolution (ppr) with detents and a push switch, Digikey 102-1914-ND. A similar Mouser supplied alternative might be the Bourns EM14A1D-C24-L032N (different pin layout). Any optical (5V compatible) or mechanical 8, 16 or 32 ppr gray code encoder should do, using a built in or external pushbutton switch. The backlit 16x2 Liquid Crystal Display (LCD) is of the HD44780 compatible variety. These come for 10 dollars or less on Ebay, postage included. Power is provided over the USB connector, either from a computer or from a repurposed 5V USB cell phone charger. The AD8307 metering circuit is constructed “dead-bug” fashion on an unetched printed circuit board, as described in the W7ZOI/W7PUA article, while the Teensy++ board sits on two 20 pin single in line sockets, mounted on a stripboard holding the voltage reference, a potentiometer for the LCD contrast and a modest number of capacitors for RF decoupling. Everything is mounted inside a Radioshack utility box, providing RF shielding. 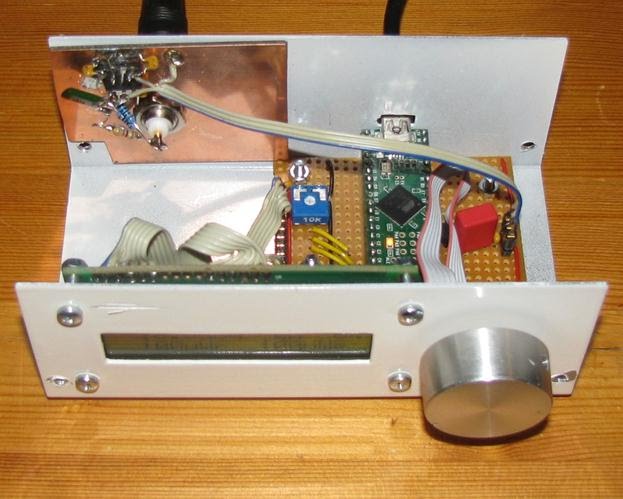 Power meter all boxed up Rotary Encoder and Pushbutton control menus: The Rotary Encoder is used to select between the following menus: 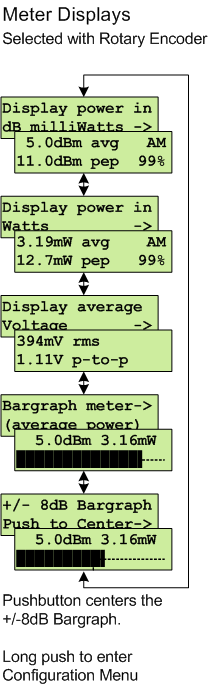 The first display is visible for one second, before switching to the second display. The pushbutton is used to centre the +/-8dB Bargraph. A long push is used to enter the Configuration Menus. All configuration settings are stored in EEPROM and are retained when the meter is powered off. Configuration Menus:  Computer readable data and USB commands The following commands are available using the the USB virtual serial port: $ppoll produces an instantaneous power reading in the format: 1234.123456789012 Power is in watts, resolution down to 10-12W (pW). $pinst, $ppep and $pavg produce a reading of instantaneous, PEP or average (1s) power in human readable form, pW to kW: Exammple: 87.9mW $pinstdb, $ppepdb and $pavgdb produce a reading of instantaneous, PEP or average (1s) power in human readable form, decibel over milliwatt (dBm): Exammple: 19.4dBm $plong produces a human readable message, example output: Power (inst, pep, avg) 10.3mW, 12.2mW, 10.4mW $pcont will trigger continuous mode reporting, 10 times per second. The format reported is the last one selected of the above ($ppoll, $pinst, $ppep, $pavg, $pinstdb, $ppepdb, $pavgdb, $plong). For example the commands: $pinst $pcont will produce continuous reporting of the instantaneous power. Continuous mode is retained if Meter is reset or power cycled. $ppoll, $pinst, $pinstdb, $ppep, $ppepdb, $pavg, $pavgdb or $plong entered while in continuous mode will switch back to single shot mode. $calset cal1 AD1 cal2 AD2 writes calibration values without having to perform a new calibration. where cal1 and cal2 are calibration setpoints 1 and 2 in 10x dBm and AD1 and AD2 are the corresponding 10bit AD values $calget retrieves the calibration values. This is useful if you are playing with the firmware. $encset x x = Rotary Encoder resolution, integer number 1 to 8. Used to decrease Encoder resolution if required. $encget returns current value of Encoder Resolution. $amset x x = minimum signal strength to display Amplitude Modulation information, -80 to 20 dBm (20 dBm effectively turns the function off). $amget returns current signal strength level to display Amplitude Modulation information. $version reports version and date of firmware The Microcontroller Firmware: The firmware, available here mirrow and at the bottom of this webpage, includes full source code and a precompiled binary ready to flash into the microcontroller. Also included is a Windows driver (.inf file), if desiring to enumerate the meter as a serial device by a computer running Microsoft Windows XP, Vista or 7. To flash the firmware into the Teensy++ 2.0 USB development board, a free utility called Teensy Loader is downloaded from the website http://www.pjrc.com. The firmware is programmed in C, using Atmel Studio 6, available for free at the Atmel website (registration is required): http://www.atmel.com/tools/atmelstudio.aspx. The basic functionality of the firmware is to measure the A/D and to calculate the resulting power indication in dB-milliwatt. To do this, all the meter needs is two accurate signal levels, 30 - 40 dB apart, as calibration points. If you build the meter using the same voltage reference and component values in front of the AD8307 as indicated in the diagram above, then I would expect reasonable accuracy with the parameters used by default in the firmware. 200W 40dB Power Tap: A 40dB power tap makes the meter suitable for accurate in-line metering of any power level from approx 1 microwatt to 500 watts min sensitivity of AD8307 < -70dBm; max input = 17dBm -70dBm + 40dB = -30dBm = 1uW 17dBm + 40dB = 57dBm = 500W I can hardly think of a better way to adjust and monitor a 1mW WSPR transmitter :) 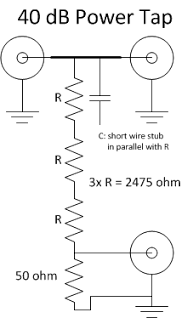 W7ZOI has a very good picture of his build of the Power Tap: http://w7zoi.net/Power%20meter%20updates.pdf. mirrow Using 3x 820 ohm 1/2W resistors in series, his power tap can handle up to 75W (~100W) for a short time period, however the resistors will quickly get very very hot. The only difference in my build is the use of 2x 1 kohm and 1x 470 ohm 3W thick film resistors (Digikey 989-1194-1-ND and Digikey 989-1211-1-ND), thus raising the power capability up to reasonably comfortable 200W, or momentary levels of ~400W. I use two 100 ohm 1/4W carbon film resistors in parallel to terminate the bottom center connector to ground. 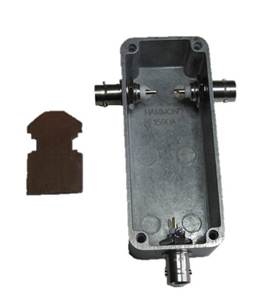 The power tap is built into a Hammond 1590A enclosure The 1 x 1.5 inch piece of single sided unetched printed circuit board connects between the two topmost BNC connectors, providing a 50 ohm match against the walls of the enclosure. The PCB is cut and filed a bit to make room for the corners in the enclosure and the protrusion of the connectors. When using flange type (BNC, N or UHF) connectors, the sides of the 1x1.5 inch PCB piece do not need to be filed as shown. A UHF connector version is only good up to approx. 200 MHz. The zig-zag mounting style of the three large resistors reduces the frequency response a bit, but the tap is still quite useable up to the 70cm band. 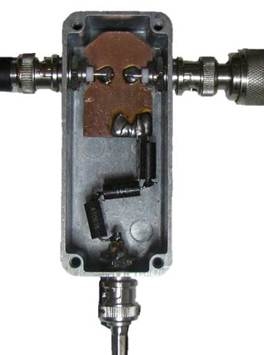 Notice the wire in parallel with the first resistor. This wire is only terminated on one side, to the PCB, and provides a little capacitive shunt over the resistor to correct for inductive errors in the UHF frequency range. Here is a VNA Plot of the input SWR and attenuation characteristics of the Power Tap:  Reasonably accurate and minimal SWR up to 70cm. At 500 MHz and beyond, everything starts falling apart. ------------------------- To download any of the files below, please click on the down arrow AD8307_PowerMeter_101.zip (103k)Loftur Jónasson, Sep 29, 2012, 6:10 PM AD8307_PowerMeter_102_AS6.zip (595k)Loftur Jónasson, Apr 28, 2013, 7:45 AM AD8307_PowerMeter_103.zip (586k)Loftur Jónasson, Oct 19, 2013, 4:02 PM AD8307_PowerMeter_104.zip (590k)Loftur Jónasson, Dec 5, 2013, 3:35 AM AD8307_PowerMeter_105.zip (593k)Loftur Jónasson, Dec 7, 2013, 6:16 AM AD8307_PowerMeter_106.zip (593k)Loftur Jónasson, Dec 12, 2013, 1:46 AM AD8307_PowerMeter_107.zip (594k)Loftur Jónasson, Jan 18, 2014, 11:43 PM AD8307_PowerMeter_108.zip (99k)Loftur Jónasson, Feb 14, 2014, 3:25 AM ------------------ Original https://sites.google.com/site/lofturj/ad8307-power-meter |

 Новые книги
 Статистика
 Группы:
 Сейчас на сайте
 Всего: 494
 Гостей: 486
 Анонимных: 0
 Пользователей: 8
 Зарегистрированные:
Portal-X